
The website below generate R code that can compute:
- Statistical power for testing a covariance structure model using RMSEA.
- The minimum sample size required to achieve a given level of power.
- Power for testing the difference between two nested models using RMSEA.
- The minimum sample size required to achieve a given level of power for a test of nested models using RMSEA.
http://www.quantpsy.org/rmsea/rmsea.htm
Monte Carlo Simulation
Monte Carlo simulation studies are often used for methodological investigations of the performance of statistical estimators under various conditions. They can also be used to decide on the sample size needed for a study and to determine power (Muthén & Muthén, 2002).
Monte Carlo Simulation Approach (Muthén & Muthén, 2002):
- Formulate hypothesis and alternate hypothesis.
- Identify statistical model or test statistic.
- Create pseudo-population.
- Determine experimental conditions (e.g.,sample size).
- Draw r samples from pseudo-population
- Implement decision rule for frequency distribution.
- Manipulate experimental condition(e.g.,samplesize)
- Rerun steps 5 through 7.
Strategy for Deciding on Sample Size (Muthén & Muthén, 2002):
- parameter and standard error biases do not exceed 10% for any parameter in the model.
- Standard error bias for the parameter in question does not exceed 5%.
- Coverage should be between .91and .98.
- Keep changing parameter of interest until statistical power=.80.
Using Mplus to detect the power:
Example: How many participants do we need to detect inter-factor r = .25 at p < .05 and power =.80 (with model specifications below)?
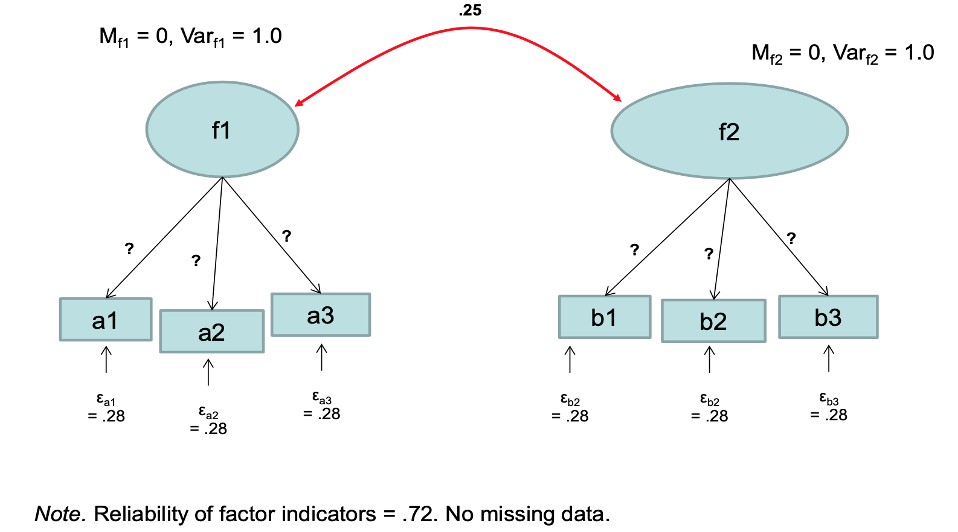
Answer:
We should get the value of the factor loading:
(x)2(1)/(x)2(1) +.28=.72
We need n=152 to detect inter-factor r = .25 at p < .05 and power =.80
Mplus syntax:
INPUT INSTRUCTIONS
TITLE: Example: Monte Carlo simulation cfa model
MONTECARLO: NAMES ARE a1-a3 b1-b3 ;
NOBSERVATIONS = 152; !YOU NEED TO CHANGE THIS TO FIND 80% TO DETECT FACTOR1 WITH FACTOR
NREPS = 500; !YOU SHOULD HAVE AT LEAST 500 REPLICATIONS FOR 95% CI OF + OR – 2.
SEED = 271664;
! PATMISS = a1 (.10) a2 (.10) a3 (.10) ! THIS IS FOR WHEN YOU WANT TO MODEL MISSING DAT
! b1 (.10) b2 (.10) b3 (.10);
! PATPROB = 1;
MODEL MONTECARLO: !Data Genertn Model
! factor item reliability: (factor loading^2)*factor variance / [(factor loading^2)*factor
! factor item residual variance = .28
factor1 BY a1-a3*.849;
factor2 BY b1-b3*.849;
factor1@1.0; [factor1@0];
factor2@1.0; [factor2@0];
a1-a3*.28; b1-b3*.28;
factor1 with factor2*.25;
ANALYSIS: PROCESS = 8;
MODEL: !Analyis Model
factor1 BY a1-a3*.849;
factor2 BY b1-b3*.849;
factor1@1.0; [factor1@0];
factor2@1.0; [factor2@0];
a1-a3*.28; b1-b3*.28;
factor1 with factor2*.25;
OUTPUT:
Software for Power Analysis:
GPOWER3 for performing power analysis can be downloaded from the following website:
https://download.cnet.com/G-Power/3000-2054_4-10647044.html
References:
Linda K. Muthén & Bengt O. Muthén (2002) How to Use a Monte Carlo Study to Decide on Sample Size and Determine Power, Structural Equation Modeling: A Multidisciplinary Journal, 9:4, 599-620, DOI: 10.1207/S15328007SEM0904_8
Preacher, K. J., & Coffman, D. L. (2006, May). Computing power and minimum sample size for RMSEA [Computer software]. Available from http://quantpsy.org/.