
• Discriminant analysis (DA) is to predict group membership (DV – Categorical variable) from a set of predictors (IV – Continuous variables). Thus, DA is MANOVA turned around.
Research question: Do PERF, INFO, VERBEXP permit he classification of students by types of learning disabilities?
- DV: Types of learning disabilities (3 groups)
- Memory: Children whose major difficulty seems to be with tasks related to memory;
- Perception: Children who show difficulty in visual perception;
- Communication: Children with language difficulty.
- IVs (predictors):
- PERF: Performance Scale IQ of the WISC;
- INFO: Information subtest of the WISC;
- VERBEXP: Verbal Expression subtest of the ITPA;
Open SPSS then:
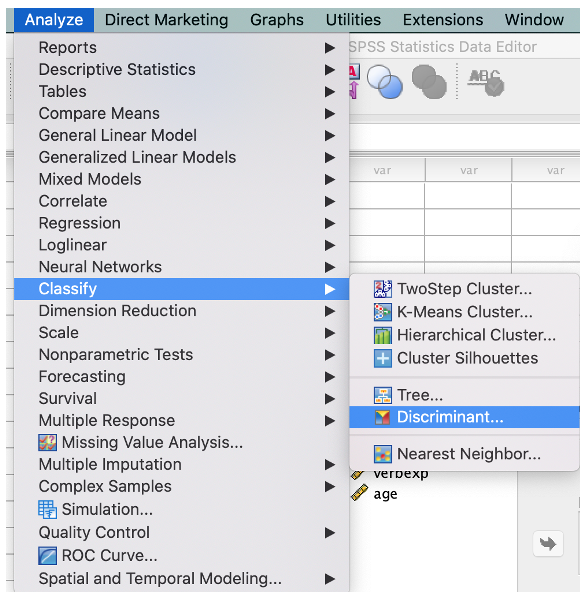
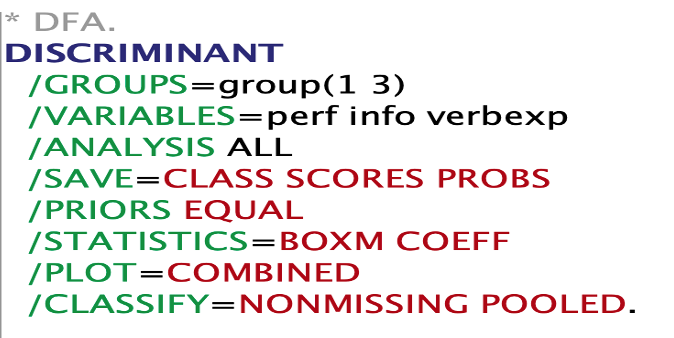
- From the menu, click on Analyze -> Classify -> Discrimiant…
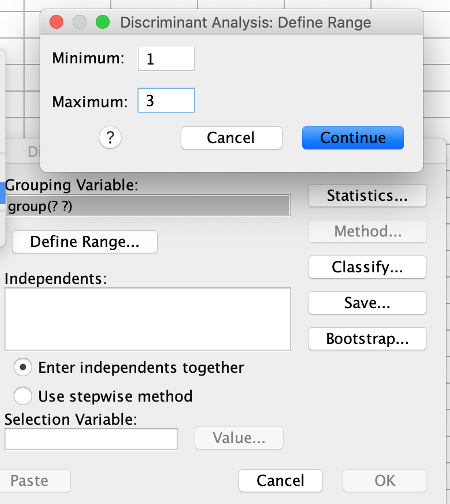
- In the appearance window, move DV (grouping variable) into Grouping Variable: -> hit Define Range… -> specify lowest and highest values of grouping -> Continue
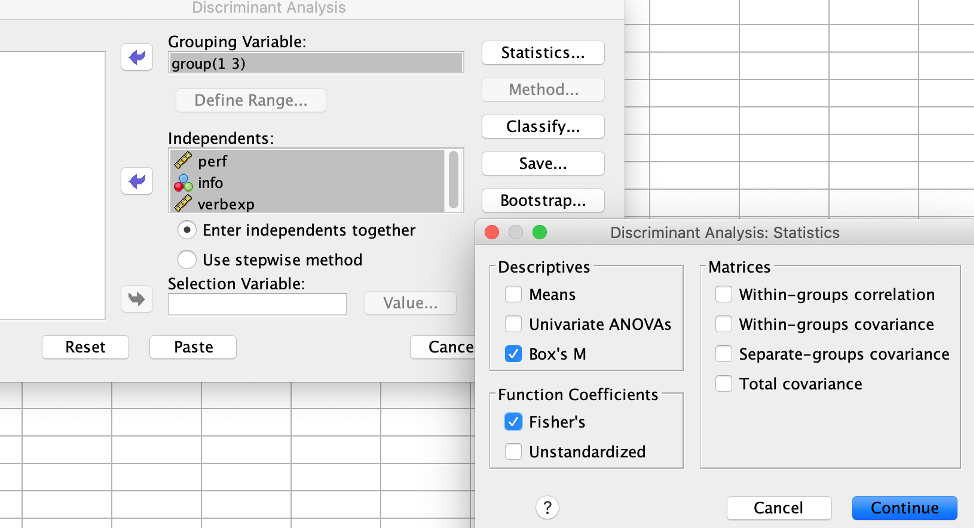
- Move all IVs to Independents: Hit Statistics… -> Check Box’s M, Fisher’s -> Continue
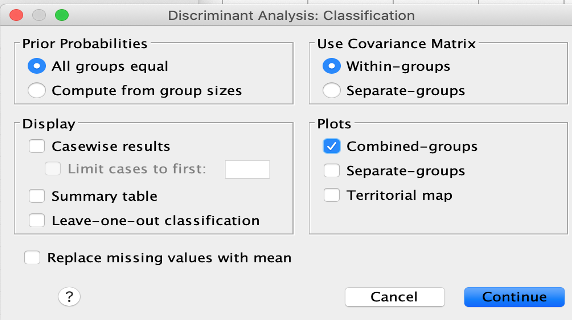
- Hit Classify… -> check Combined-groups -> Continue
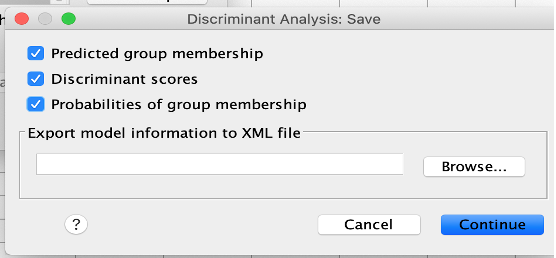
- Hit Save… -> check predicted group membership, discriminant scores, probabilities of group membership -> Continue
- Hit Continue and then hit Paste.


- Check the dataset and discuss what new added variables (Dis_1; Dis1_1; Dis2_1; Dis1_2; Dis2_2; Dis3_2) are
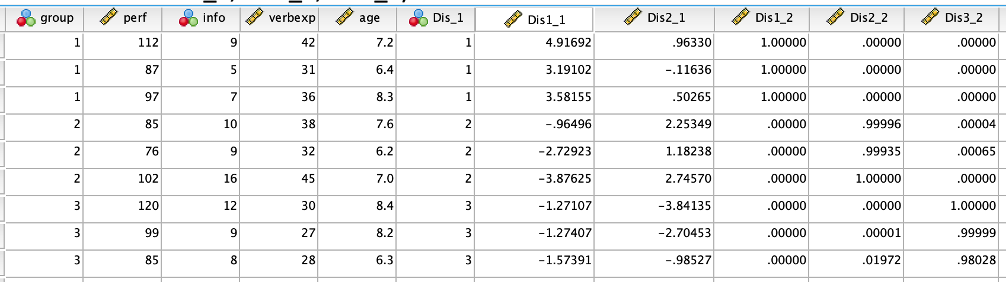
- Dis_1: Predicted group membership
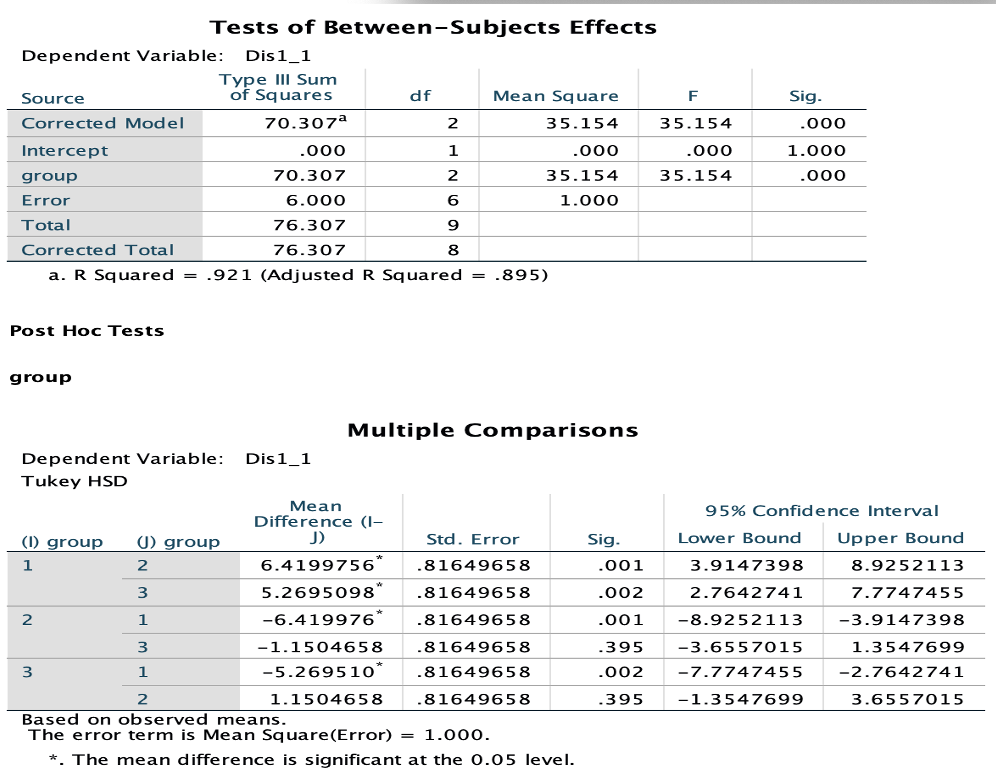
- Dis1_1: Score on discriminant function 1
- Dis2_1: Score on discriminant function 2
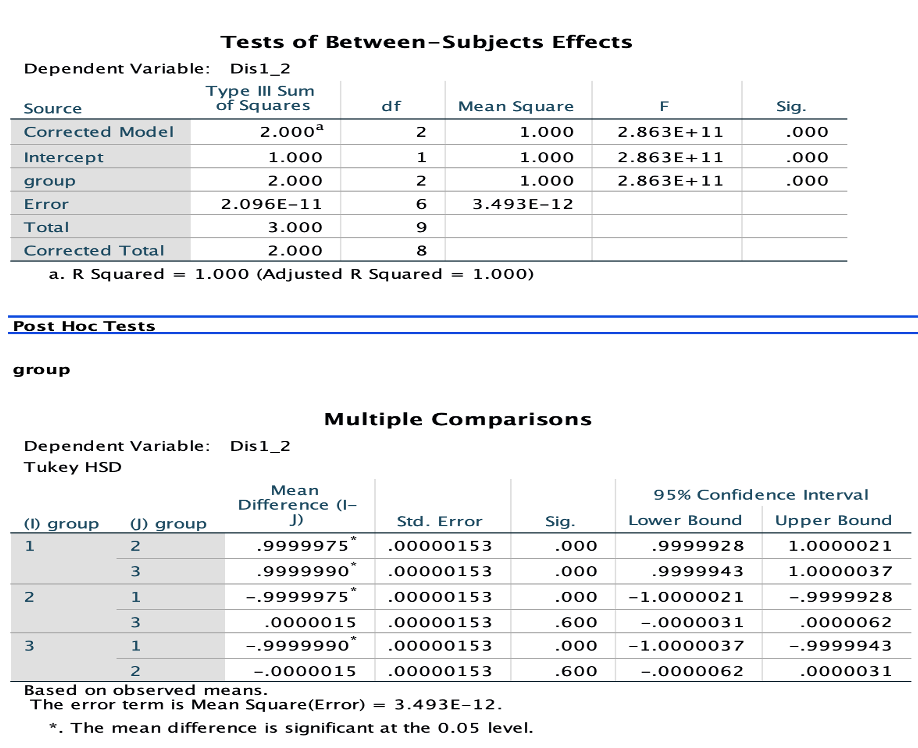
- Dis1_2: Probability of being in group1
- Dis2_2: Probability of being in group2
- Dis3_2: Probability of being in group3
Write-up (APA format):
Both discriminant functions were found to be statistically significant (Wilks’s Λ = .012, (6) = 21.98, p = .001 for discriminant function 1 through 2; Wilks’s Λ = .16,
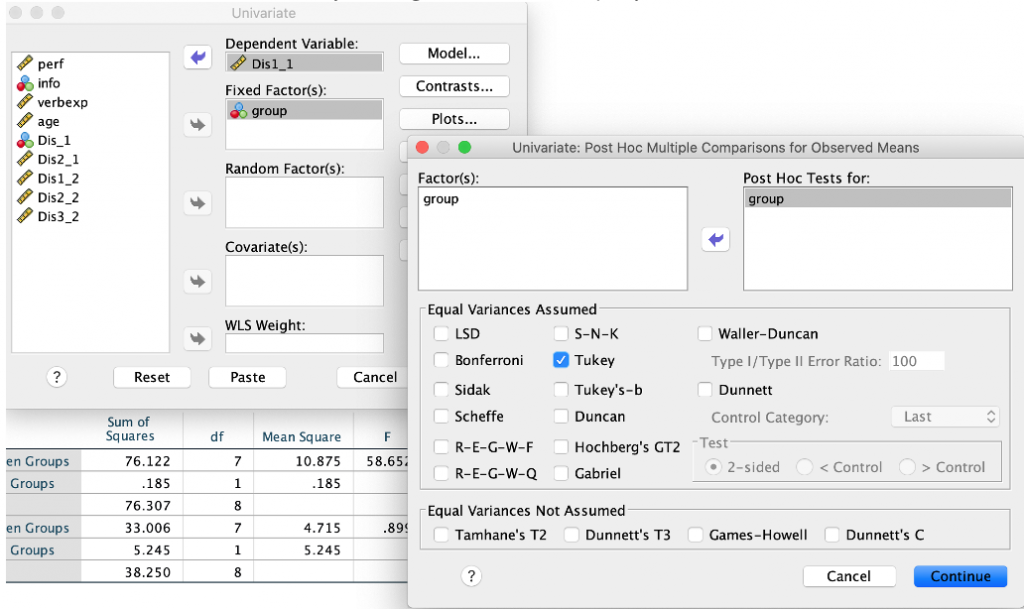
(2) = 9.26, p = .01 for discriminant function 2). The first discriminant function explains 68.6% of variance and the second discriminant function explains the rest of variance (31.4%). Canonical correlations are .96 and .92 for both discriminant functions, indicating that 92% and 83% of variances were explained by the relationship between predictors and group membership by DF1 and DF2, respectively. Discriminant function 1 has the largest relationship with information, followed by performance and verbal expression. Discriminant function 2 has the largest relationship with verbal expression, followed by performance and verbal expression. Pairwise comparison on DF1 scores indicates that differences on DF1 were found in the following pairs: group 1 (M = 3.90) vs. group 2 (M = -2.52) and group 1 (M = 3.90) vs. group 3 (M = -1.37). In addition, pairwise comparison on DF2 scores indicates that differences on DF2 were found in the following pairs: group 1 (M = .45) vs. group 3 (M = -2.51) and group 2(M = 2.06) vs. group 3 (M = -2.51) .