
A researcher wants to compare differences in score on the reading subtest of the Wide Range Achievement Test (WRAT-R) and score on the arithmetic subtest (WRAT-A) between students with treatment and those without treatment. Then, a researcher wants to see whether treatment effect differs by degree of disability (i.e., mild, moderate, and severe).
- IV1: Treatment vs. Not (2 levels)
- IV2: Disability (3 levels – Mild, Moderate, Severe)
- Covariate: IQ
- DVs: WRAT-R and WRAT-A
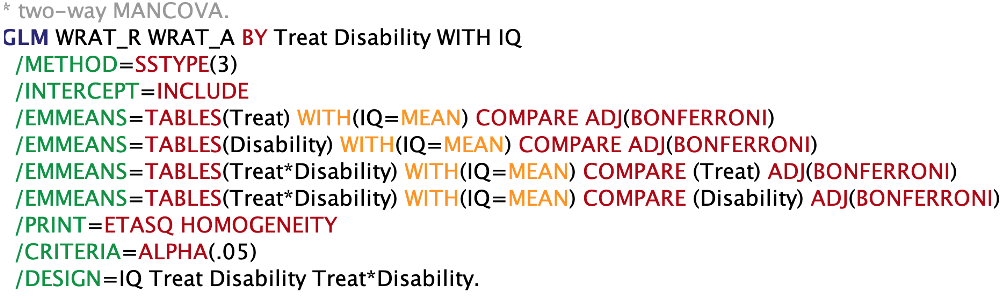
- From the menu, click on Analyze -> General Linear Model -> Multivaraite…
- In the appearance window, move WRAT_R and WRAT_A (Dependent variables) to the Dependent Variables: box; Treat & Disability (Independent variables) to the Fixed Factor(s):; IQ into Covariate(s)…


- Then, hit the Options… on bottom right menu. From a new window, move Treat, Disability, and Treat*Disability (IV) to Display Means for: -> check Compare main effects -> check Estimates of effect size and Homogeneity tests

- Hit Continue and then hit Paste.
Output:
Write up (APA format):
A two-way Multivariate Analysis of Covariance (MANCOVA) was performed to examine whether the reading subtest of the Wide Range Achievement Test (WRAT-R) and score on the arithmetic subtest (WRAT-A) differ by treatment status, disability, and their interaction, after controlling for IQ.
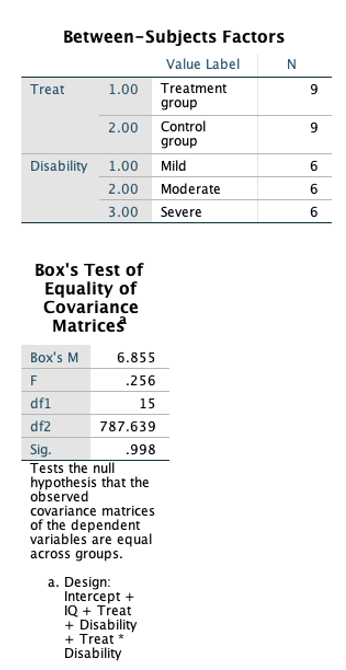
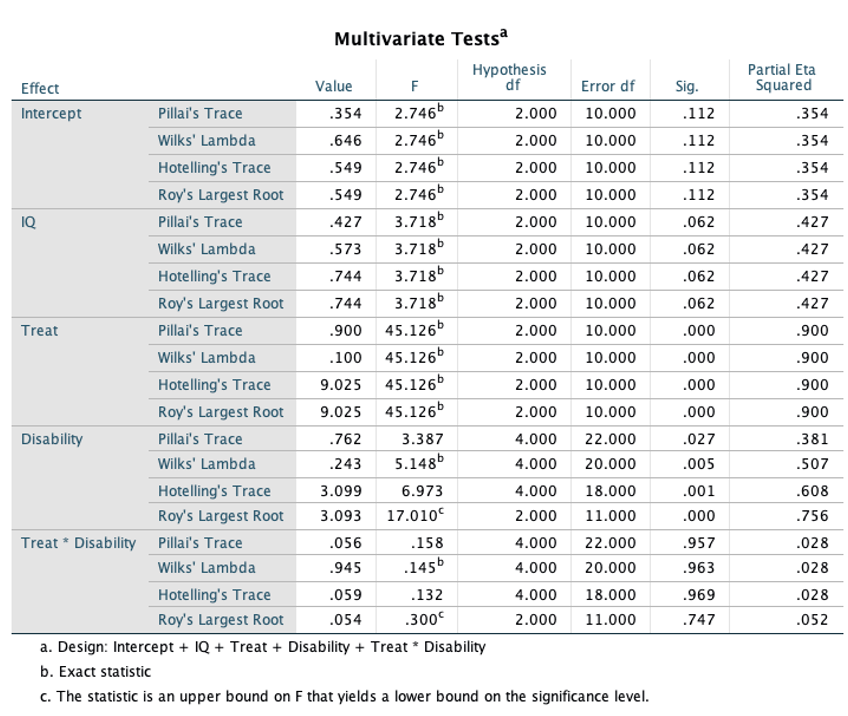
Results of evaluation assumptions of normality, homogeneity of variance-covariance matrices [The Box’s M of 1.53 indicates that the homogeneity of covariance matrices across groups is assumed (F(15, 787.64) = .26, p = .99], linearity, and multicollinearity were satisfactory. With the use of Wilks’ criterion, the combined DVs were significantly different by levels of disability (Wilk’s Λ = .24, F(4, 20) = 5.15, p = .005, partial η2 = .51) and treatment group (Wilk’s Λ = .10, F(2, 10) = 45.13, p < .05, partial η2 = .90), after controlling for IQ. No significant interaction was found (Wilk’s Λ = .95, F(4, 20) = .15, p = .96, partial η2 = .03), after controlling for IQ.
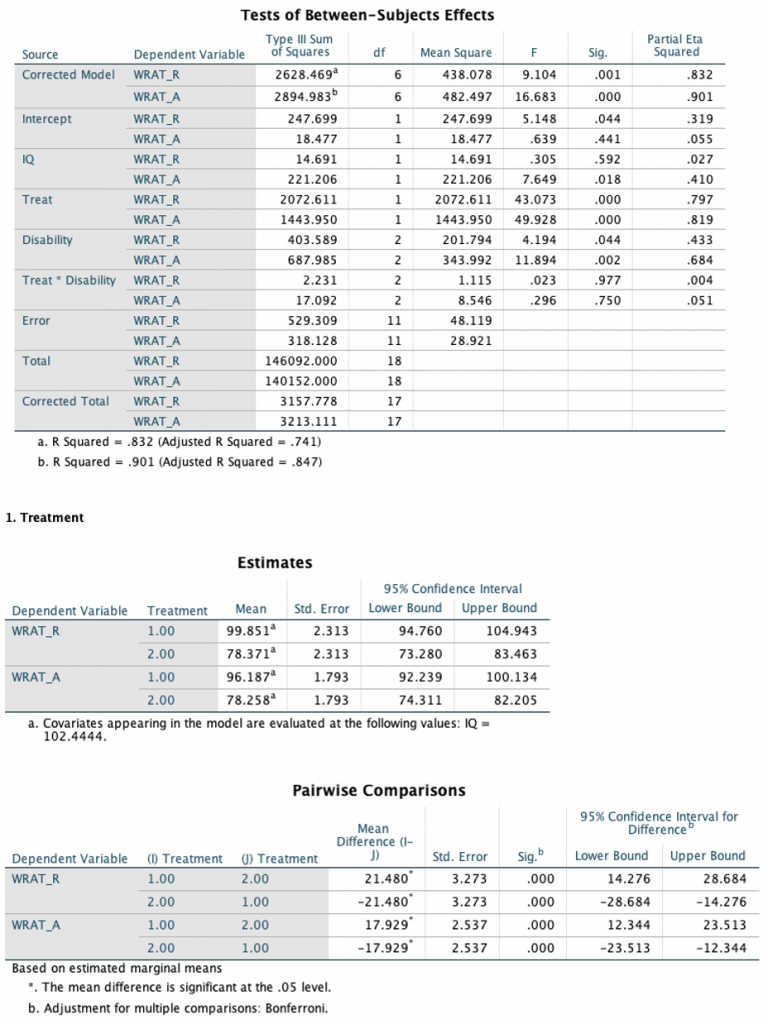
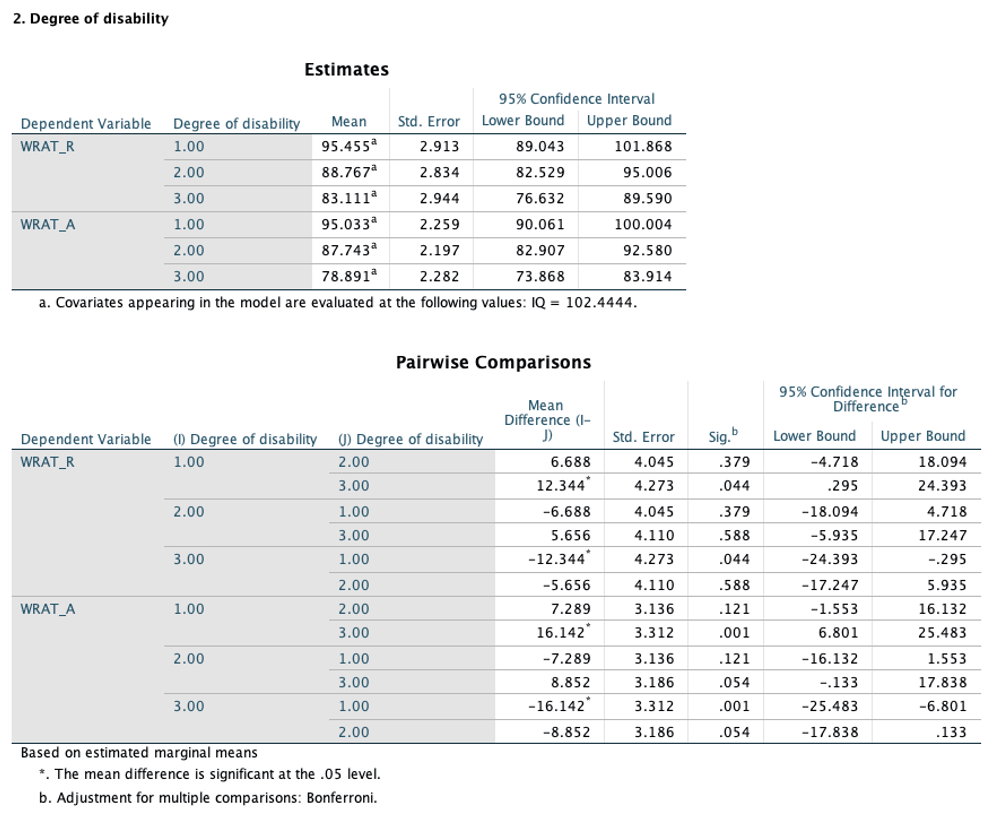
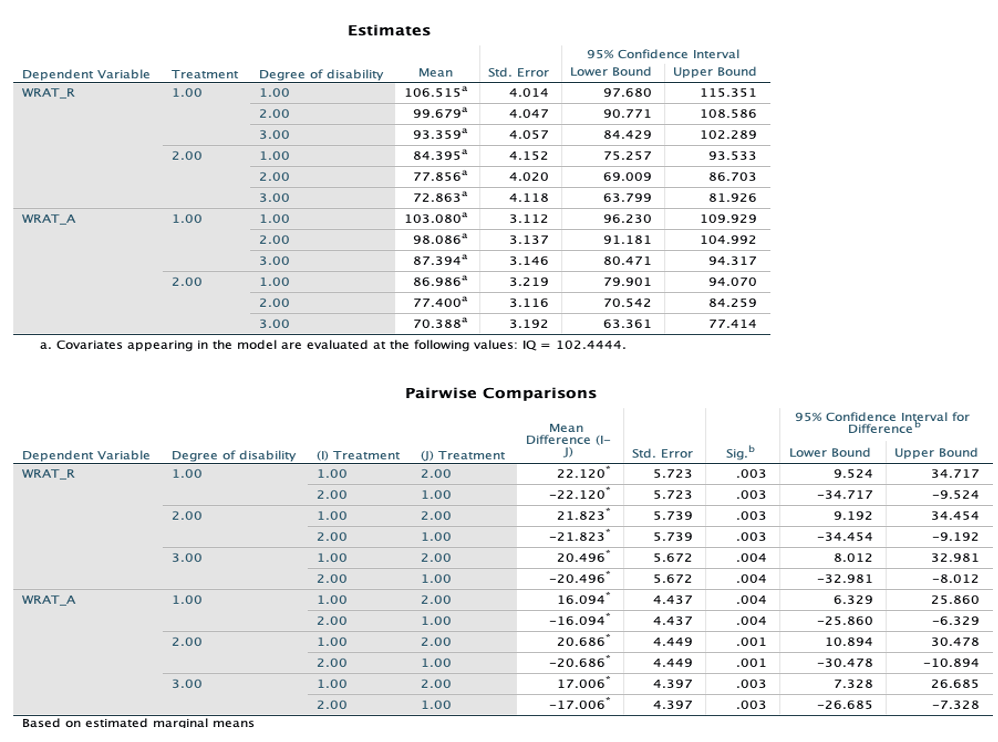
To investigate the impact of each effect on the individual DVs, a univariate F-test using an alpha level of .025 was performed. Pair-wise comparison followed by a univariate F-test indicates that the significant difference was found between children with mild disability and those with severe disabilities, only in WRAT-A. The main effects of treatment were significant on both WRAT-R and WRAT-A, with approximately equal effect. In particular, treatment group showed significantly higher means on both WRAT-R and WRAT-A, when compared to control group.